Problem 65-4
Source:
Problem elaborated by the author of the site.
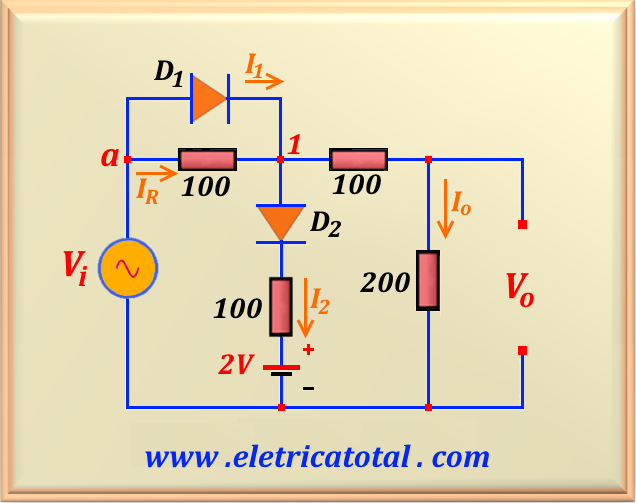
Let be the circuit shown in the Figure 65-04.1. Assume that Vi = 12 sin 1000 t and VD = 0.7 volts on the conduction. Calculate the voltage Vo and sketch a graph with the circuit transfer characteristic.
Solution of the Problem 65-4
We must pay close attention to the fact that when IR reaches the value of 7 mA , the source voltage will be Vi = 400 x 7 (mA) = 2.8 volts and, of course, Vo = 1.4 volts. When
Vi > 2.8 volts the voltage at point 1 is equal to V1 = Vi - 0.7 . The current over the resistor that is in parallel with D1 will remain constant during the positive cycle of the sine wave, except when the input voltage reduces its value below + 2.8 V , because in this case the diode D1 will be cut. Therefore, it is evident
that any current value above 7 mA that the circuit requires, this excess current must be supplied by diode D1. Thus, for input voltage values greater than
0.7 V, the output voltage will be given by:
In the case of the D2 diode, note that there is a 2V battery in series with it. Therefore, this diode will only conduct when the voltage at point 1 reaches the value of
V1 = 2.7 V . This means that the input voltage must reach the value of
Vi = V1 + 0.7 = 2.7 + 0.7 = 3.4 V. However, if D2 is conducting does not change the output voltage equation, because the voltage at point 1 is independent of this circuit.
Therefore, the correct answer for the positive part of the sinusoid is:
Now let's look at what happens to the negative part of the sinusoid. Note that
D1 and D2 will always be cutting off. Therefore, the circuit will function, for the negative part of the sinusoid, as if the diodes do not exist in the circuit. Then the circuit comes down to the voltage source Vi and the four resistors. Therefore, for the
negative part of the sinusoid, the output voltage is given by:
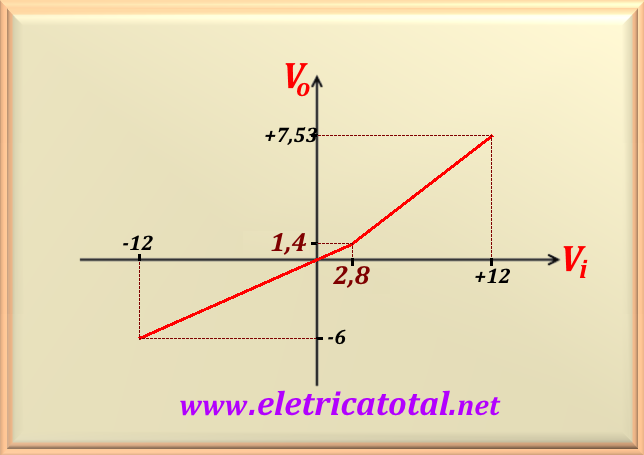
In the Figure 65-04.2 we see the graph of the circuit transfer characteristic. Note that the output voltage ranges from - 6 volts to +7.53 volts when the input voltage ranges from
-12 ≤ Vi ≤ +12 .
In the graph, for a real diode, the slope change of the lines should be smoothed. As we are using the model of an ideal diode is worth the above representation.